Why the Market Crash Could Drive a 40% Rally for HBAR Price
Hedera price has declined sharply over recent sessions, recording a 15% pullback that pushed HBAR lower. While the move appears bearish at first glance, on-chain and technical indicators suggest a different narrative.
Investor behavior points to accumulation rather than panic selling. This shift positions the decline as a potential opportunity rather than a breakdown.
Sponsored
Hedera Following Bitcoin Was The Problem
HBAR’s recent weakness closely mirrors Bitcoin’s price action. The altcoin shares a strong correlation of 0.98 with BTC. Such a high correlation makes HBAR highly sensitive to broader market moves. When Bitcoin fell below $80,000, HBAR followed almost immediately.

This relationship explains the sudden drop below $0.100. The move was less about Hedera’s fundamentals and more about market-wide pressure.
In periods of sharp Bitcoin declines, highly correlated assets often experience exaggerated moves. That dynamic played out clearly during HBAR’s recent slide.
Want more token insights like this? Sign up for Editor Harsh Notariya’s Daily Crypto Newsletter here.
Sponsored
HBAR Holders Are Doubling Down
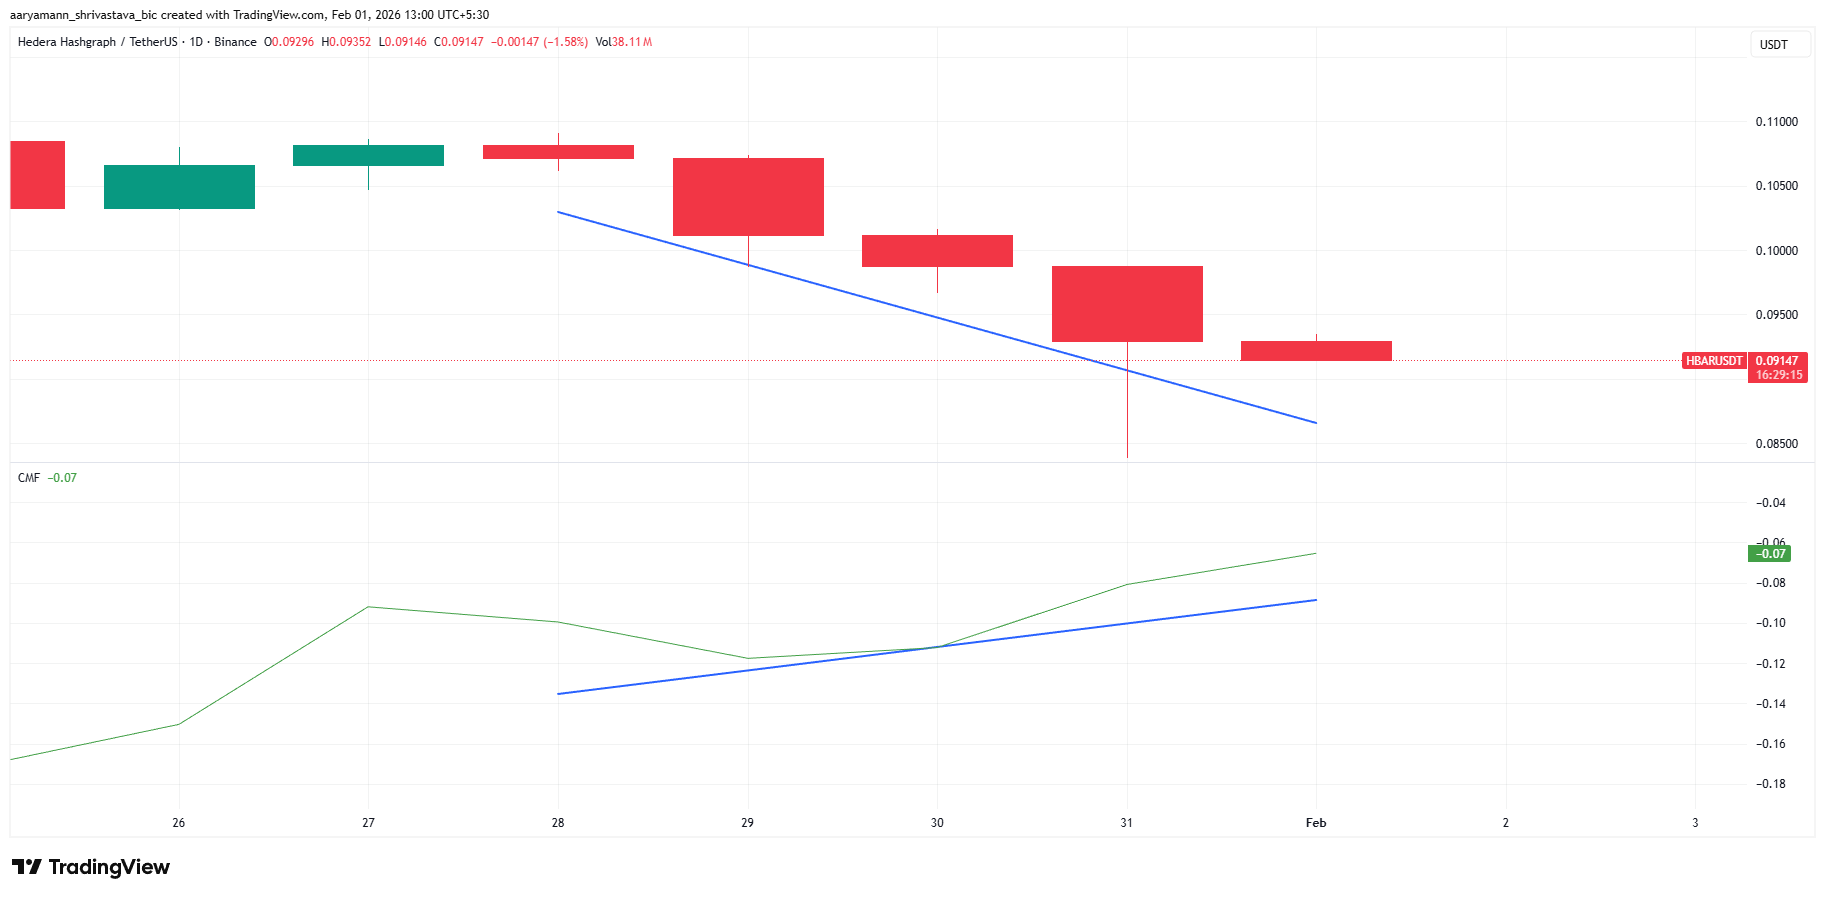
Despite price weakness, HBAR holders are pushing back against the bearish outlook. The Chaikin Money Flow indicator shows a notable divergence. Over the past four days, CMF formed lower highs while HBAR price printed lower lows. This pattern signals growing inflows despite a decline in price.
Bullish divergence often precedes reversals. It suggests investors are accumulating while the price remains suppressed.
Although HBAR has yet to reflect this demand, capital inflows are building beneath the surface. This disconnect increases the probability of a rebound once selling pressure eases.
Sponsored
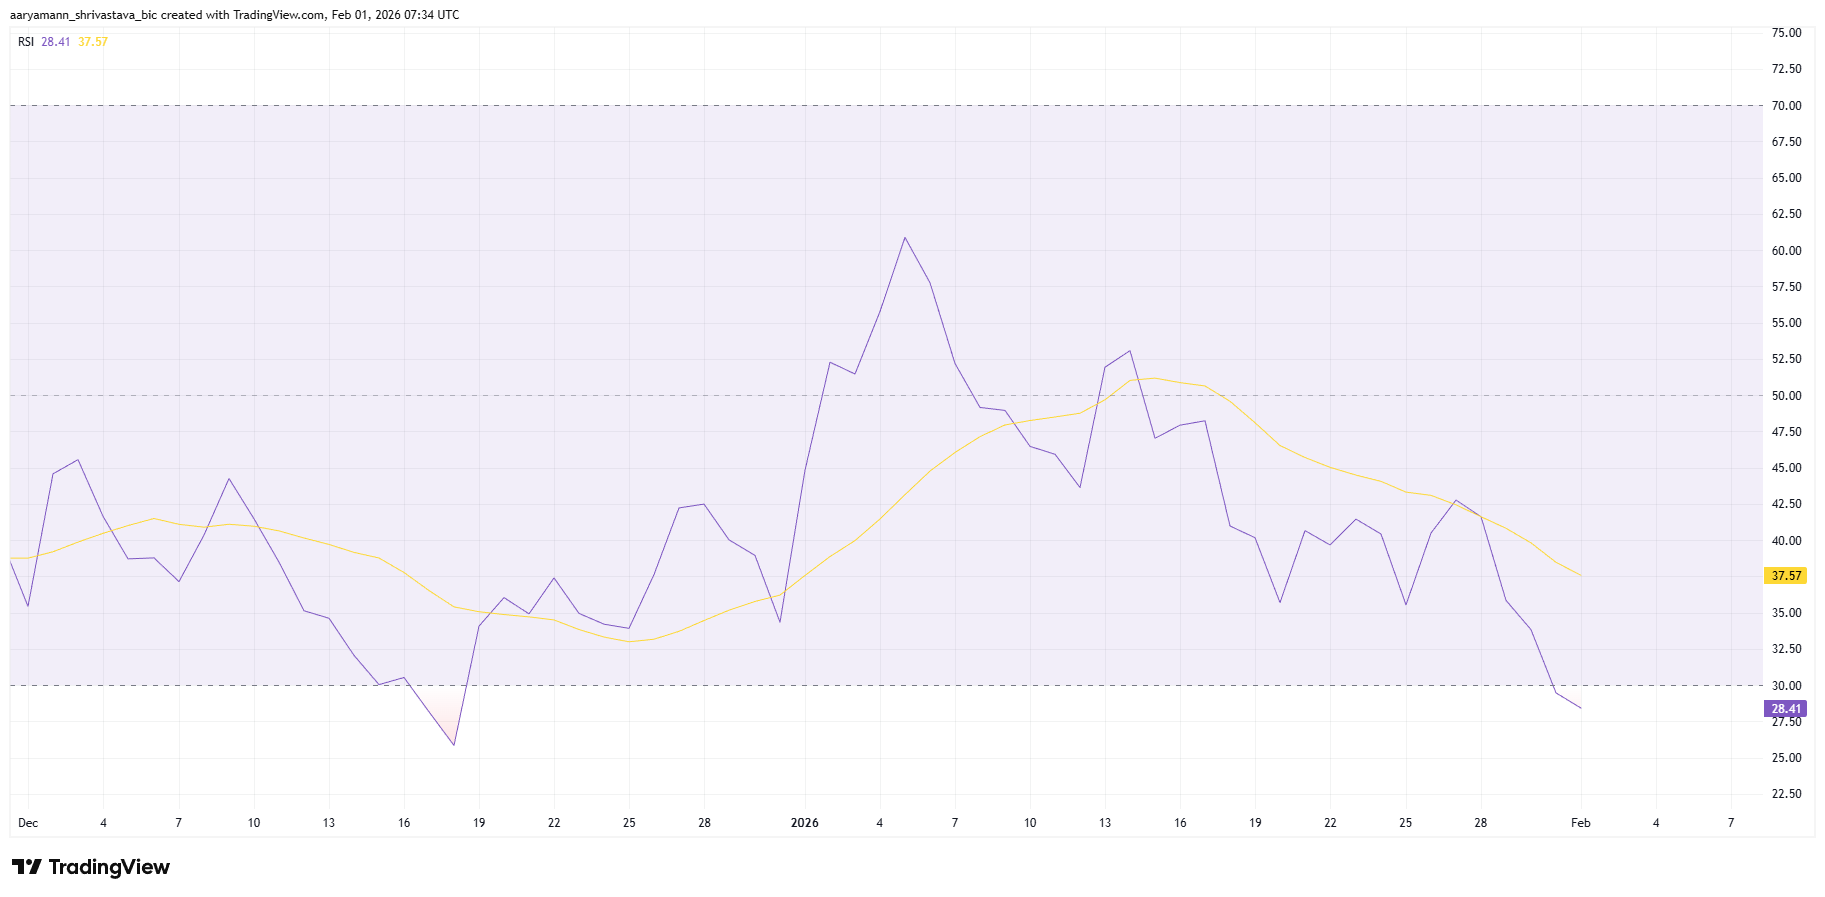
The Relative Strength Index further supports a bullish setup. HBAR’s RSI has dropped below the 30.0 threshold, placing the asset firmly in oversold territory. Oversold conditions often indicate selling exhaustion rather than sustained weakness.
Historically, assets trading at these levels experience a slowdown in sell orders. Lower prices tend to attract buyers seeking value entries. For HBAR, this environment increases the likelihood of stabilization and recovery, especially when combined with rising inflows.
Sponsored
HBAR Price Eyes Breakout
HBAR price is trading near $0.091 at the time of writing. The altcoin has been moving within a descending broadening wedge for roughly a month. This structure formed after a failed breakout attempt in mid-January. Such patterns often resolve with strong directional moves.
A confirmed breakout from the wedge projects a 43% rally toward $0.146. That target reflects a broader bullish macro scenario. In the near term, HBAR must first reclaim $0.103. A move toward $0.114 would confirm early breakout momentum and validate bullish signals.
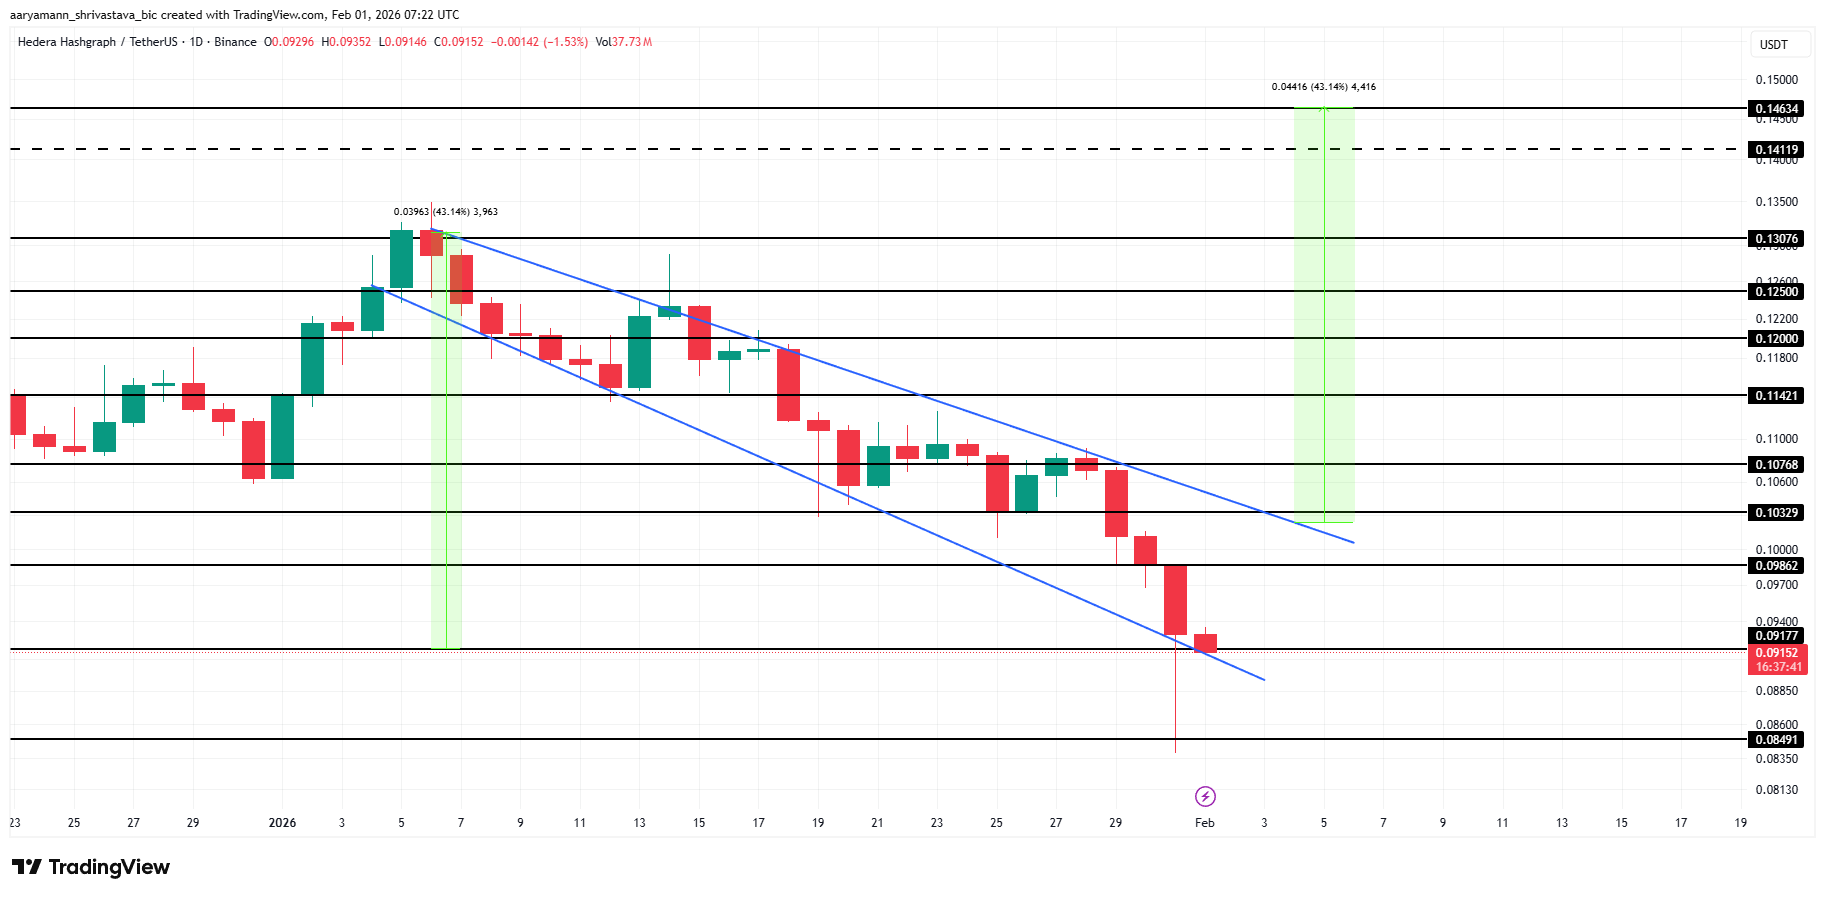
Downside risk remains if conditions deteriorate further. Continued Bitcoin weakness could override positive indicators. If HBAR loses support at $0.091, the price may slide toward $0.084. Such a move would invalidate the bullish thesis and delay any recovery attempt.