Bitcoin (BTC/USD) Price Downsizes, Averaging $45,000
Bitcoin Price Prediction – December 14There have been differential signs that the BTC/USD price downsizes, averaging $45,000 support line. The crypto economy had earlier moved down to $46,299 before trading around $47,030 at a smaller percentage rate of about 0.40.
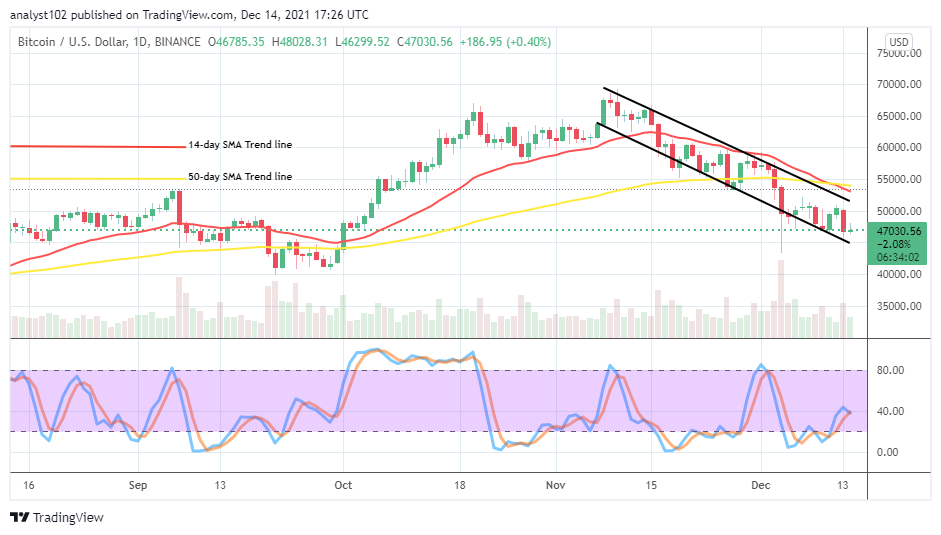
BTC/USD Market Key Levels:Resistance levels: $52,500, $55,000, $57,500Support levels: $45,000, $42,500, $40,000BTC/USD – Daily ChartThe BTC/USD daily chart reveals that the crypto-economic price downsizes, averaging a $45,000 support level. As of writing, a tiny bullish candlestick seems, taking a formation near the lower bearish trend line drawn. The 50-day SMA indicator has been briefly intercepted southward above the bearish channel trend lines. The Stochastic Oscillators have moved northbound. They have closed the lines at the range of 40 to beacon recourse of a lowering situation presently in the market.
Will the BTC/USD market be able to rebound soon as the crypto-economic price downsizes, averaging $45,000?
Over a couple of sessions, there have been rises and falls above $45,000 since the succeeding days’ operations of the last significant decline that occurred on December 4. The situation has again forced the crypto-economic price downsizes, averaging $45,000. Being as it is, the trading condition portends that there has been no strong stance for the market to return to upswing momentums.
In a continuation of shorting the BTC/USD market positions, sellers may, in the first place, hold to a spot when price actively tends to succumb to a falling force within the bearish channel trend lines before considering going for a sell order. Secondly, they needed to consolidate stances around support level at $45,000 to move down the market further against the valuation of the base crypto. But, they should be wary of rebounding movement in no time at that value line.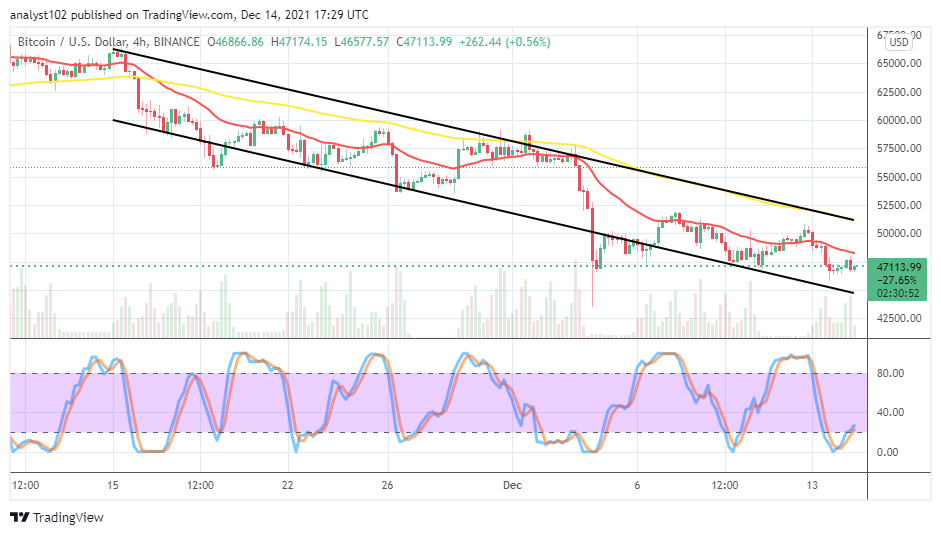

BTC/USD 4-hour Chart
The BTC/USD medium-term chart shows that the crypto-economic price downsizes, averaging $45,000. All the trading SMA indicators are above the current price level. The 50-day SMA trend line is over the 14-day SMA trend line. The Stochastic Oscillators have moved northbound from the oversold region, slightly past the range of 20. And they still point toward the north. That gives a lighter-promising note that the crypto price may soon witness a line of uprisings.
Looking to buy or trade Bitcoin (BTC) now? Invest at eToro!

68% of retail investor accounts lose money when trading CFDs with this provider.
Read more: