Bitcoin Price Prediction: BTC/USD Drops Below $44,000
Bitcoin Price Prediction – February 17
The Bitcoin price prediction sees a 7.19% price decline over the past few hours as the cryptocurrency fails at $44,195 and heads lower.
BTC/USD Long-term Trend: Bearish (Daily Chart)
Key levels:
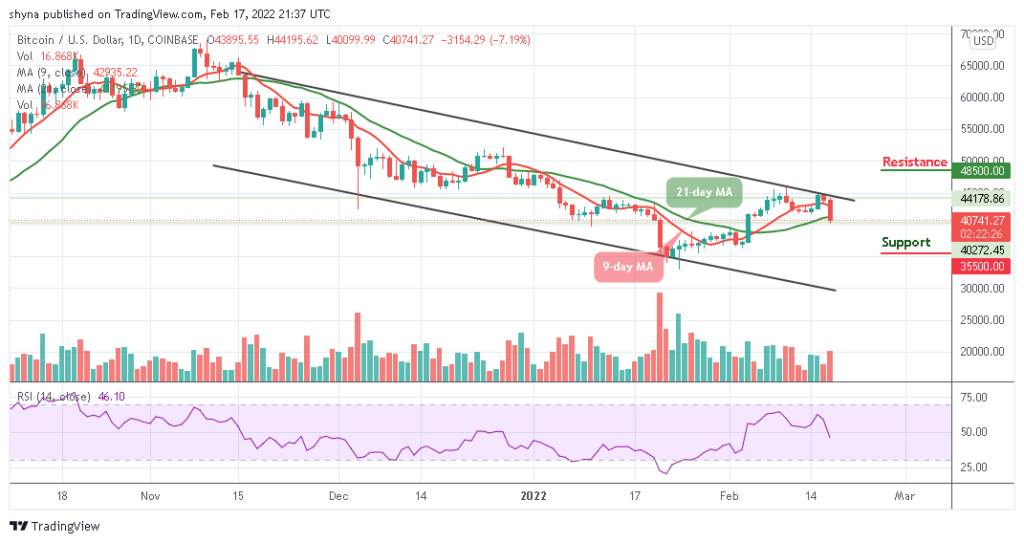
Resistance Levels: $48,500, $50,500, $52,500

Support Levels: $35,500, $33,500, $31,500
BTC/USD loses its momentum after touching key resistance above $44,195. As of writing, the pair is down 7.19% on the day at $40,741 trading below the 9-day and 21-day moving averages. Looking at the daily chart, Bitcoin may struggle to close above $45,000, and if it does this, it should be free to rise well above $50,000 if it moves in the next positive direction.
Bitcoin Price Prediction: What Could be the Next Direction for Bitcoin?
According to the daily chart, traders can see that since yesterday, the Bitcoin price has not been able to close above the resistance level of $45,000. The coin has been struggling to break this level over the past few days of trading. Moreover, in today’s session, the coin attempted to push higher above the channel, but the sellers quickly stepped in and start pushing the coin lower to reach the current level at $40,741.27.
Moreover, the $40,000 may serve as the nearest support level, which may likely make room for the coin to fall further with the supports of $35,500, $33,500, and $31,500. The technical indicator Relative Strength Index (14) nosedives below 50-level to indicate a downward movement. Meanwhile, BTC/USD may likely see the resistance levels of $48,500, $50,500, and $52,500 if it finds its way back above the moving averages.

BTC/USD Medium-Term Trend: Bearish (4H Chart)
On the 4-Hour chart, the Bitcoin price hovers around $40,698 and may take time to persistently trade above $42,000. More so, if the bulls begin to gather strength and regroup, the upward movement may be able to near the $43,000 and $45,000 resistance levels.
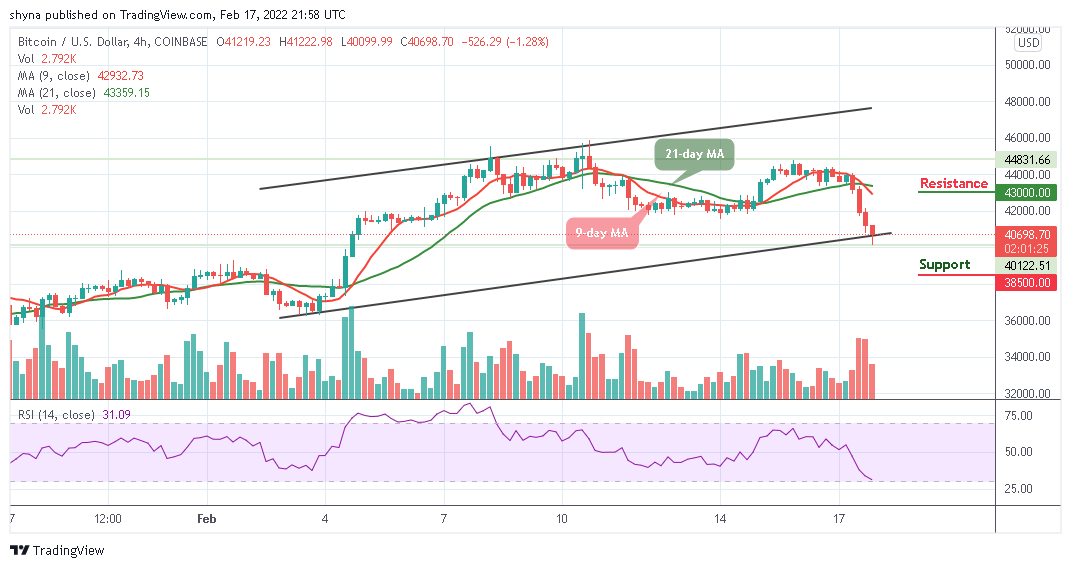
However, on the downside, immediate support could be located around the $40,000 level while the main support is at the $39,000 level. The price may remain below the lower boundary of the channel if the bears step back into the market, a further movement could reach the critical support at $38,500 and below. Technically, BTC/USD is currently moving bearishly as the Relative Strength Index (14) moves to cross into the oversold region.
Looking to buy or trade Bitcoin (BTC) now? Invest at eToro!
68% of retail investor accounts lose money when trading CFDs with this provider
Read more: