Bitcoin Price Prediction: BTC/USD Drops Beneath $64,000
Bitcoin Price Prediction – November 15
After touching the daily high at $66,339, the Bitcoin price breaks beneath $60,000 and heads toward $63,000.
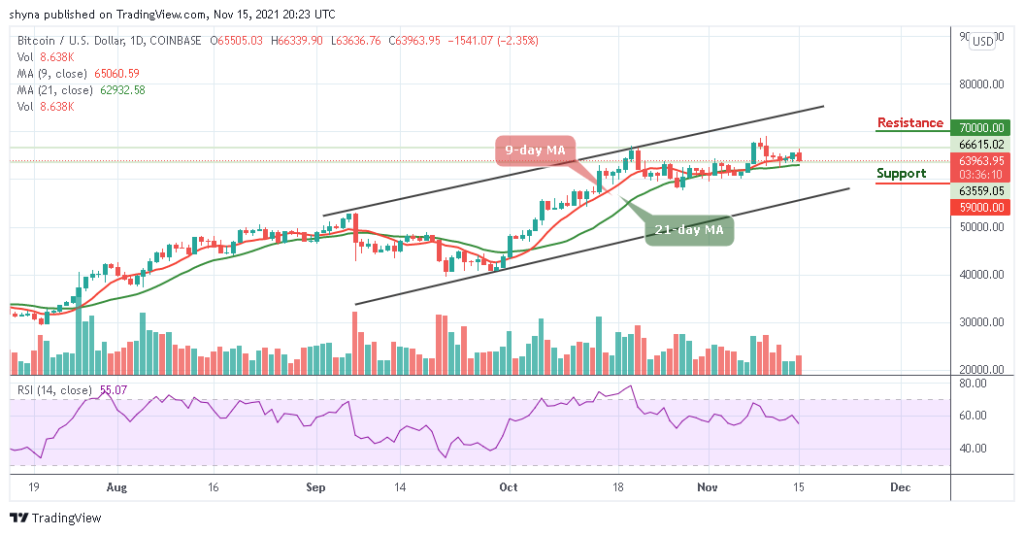
BTC/USD Long-term Trend: Ranging (Daily Chart)
Key levels:
Resistance Levels: $70,000, $72,000, $74,000

Support Levels: $59,000, $57,000, $55,000
BTC/USD is seen dropping with a sharp loss of 2.35% today as the cryptocurrency falls beneath the $64,000 support level to reach the daily low at $63,636. Looking at, the daily chart, it reveals that the support level of $63,000 is a very important as it is expected to provide strong support moving forward.
Bitcoin Price Prediction: Bitcoin (BTC) Ready to Drop More
The Bitcoin price is now trading below the 9-day moving average at support provided by the 21-day moving average; however, a break below this trend line may cause Bitcoin price to unwind toward the $61,000 support level. Meanwhile, the cryptocurrency is in a critical position right now with the next few days focusing on the downward trend. Meanwhile, a drop towards the lower boundary of the channel could locate the supports at $59,000, $57,000, and $55,000.
Moreover, if the buyers can rebound from the current support level at $63,963, the first level of resistance could come at $66,500. However, any further bullish movement may likely follow by the potential resistance at $70,000, $72,000, and $74,000 levels. On the other hand, if the first digital asset breaks here, the market price may be on the verge of turning bullish. At the moment, the technical indicator Relative Strength Index (14) is facing the south, to give more bearish signals.

BTC/USD Medium-Term Trend: Bearish (4H Chart)
According to the 4-hour chart, BTC/USD has been facing immense turbulence after touching the daily high of $66,339 with sellers forcing its price down to the lows of $63,800. If the bulls decide to push the market price back above the 9-day and 21-day moving averages, the coin may likely hit the resistance at $66,000 and above.
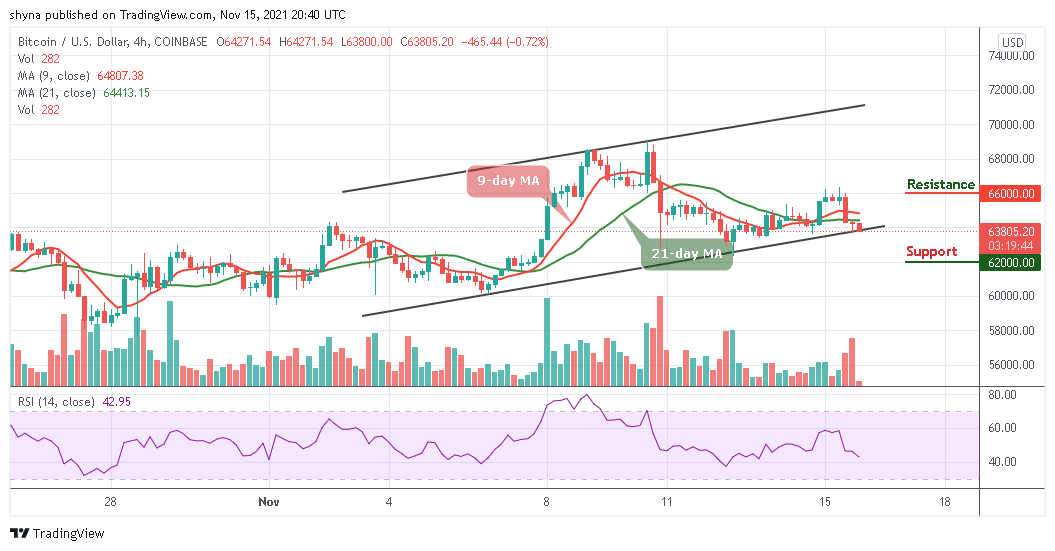
However, it now appears that the cryptocurrency is at risk of seeing further downside in the near term, as the multiple attempts to shatter its $63,000 support seem to indicate that bears are building momentum. As the Relative Strength Index (14) prepares to cross below 40-level, the coin may locate the critical support at $62,000 and below.
Looking to buy or trade Bitcoin (BTC) now? Invest at eToro!
68% of retail investor accounts lose money when trading CFDs with this provider
Read more: