Bitcoin Price Prediction: BTC/USD Recovers to $58,000
Bitcoin Price Prediction – November 29
The Bitcoin price prediction shows that BTC is shooting close to $58,000 as it has done a little to flip the market sentiment at this stage.
BTC/USD Long-term Trend: Ranging (Daily Chart)
Key levels:
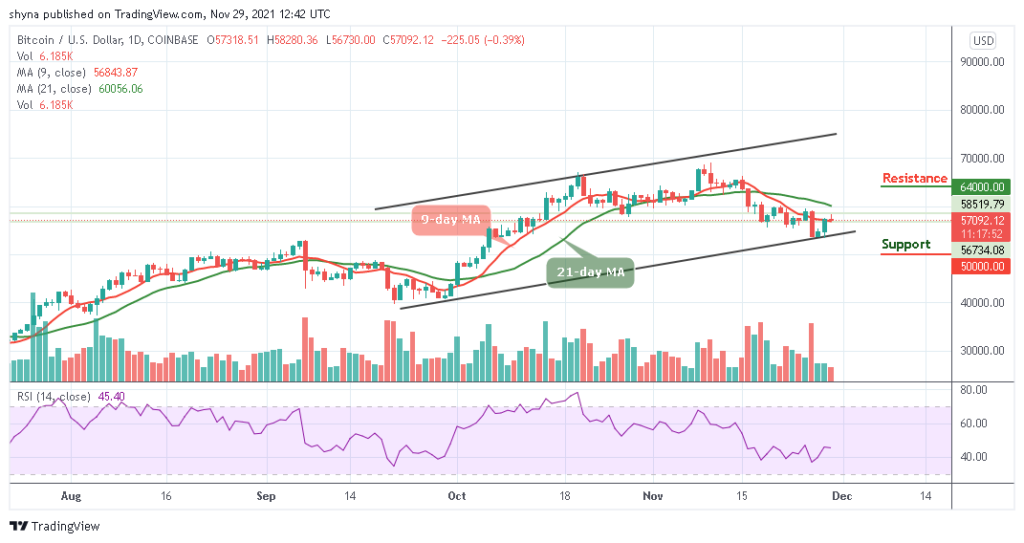
Resistance Levels: $64,000, $66,000, $68,000

Support Levels: $50,000, $48,000, $46,000
Looking at the daily chart, BTC/USD is retreating towards the $57,000 and it is likely to start a new increase as long as there is no close below this level. During the European session today, the Bitcoin price experiences a steady increase above the 9-day moving average as the coin hovers at $57,092. At the moment, the Bitcoin price keeps hovering within the channel.
Bitcoin Price Prediction: BTC Price Ready to Shoot Up
The Bitcoin price is seen retracing and trading within the moving averages as the market price stays under the daily high of $58,280 resistance to give a sign of bullish momentum. More so, further increase in the bullish momentum may have to increase the price above this level; another resistance may come at $60,000 before reaching the potential resistance of $64,000, $66,000, and $68,000 levels.
However, if the resistance level of $57,000 failed to hold, it may reverse and face the support level at $55,000; further increase in the selling pressure may push down the price towards the lower boundary of the channel and possibly hit the critical supports at $50,000, $48,000, and $46,000. Meanwhile, the technical indicator Relative Strength Index (14) signal line is moving above 45-level to indicate either a sideways movement or bullish movement.

BTC/USD Medium – Term Trend: Ranging (4H Chart)
According to the 4-hour chart, the Bitcoin price is seen trading above the 9-day and 21-day moving averages at $57,785. At the time of writing, the Bitcoin price is ready to cross above the upper boundary of the channel but any bearish cross below the 9-day moving average may drag the coin to the support level of $55,500 and below.
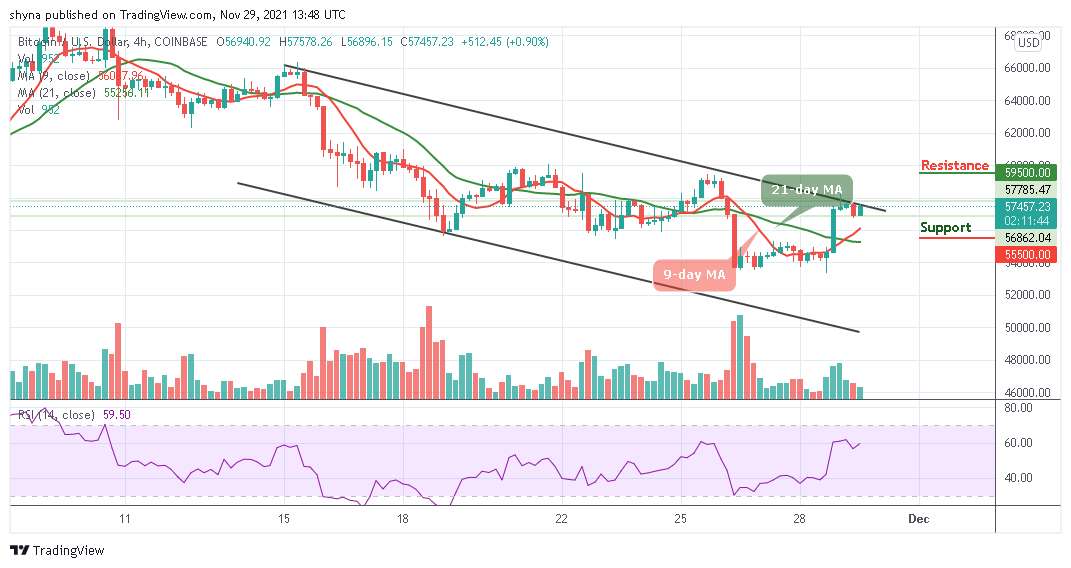
Furthermore, if the king coin finds a decent resistance level around $58,000 level, it may continue the bullish movement above the upper boundary of the channel which may likely reach the resistance level of $59,500 and above. In other words, the technical indicator Relative Strength Index (14) is seen moving to cross above 60-level, suggesting additional bullish signals into the market.
Looking to buy or trade Bitcoin (BTC) now? Invest at eToro!
68% of retail investor accounts lose money when trading CFDs with this provider
Read more:
How to buy BitcoinHow to buy Cryptocurrency