
BTC/USD Bears May Run Out as Bulls Focus at $44,000
Bitcoin Price Prediction – January 16
Despite the rejection, the Bitcoin price prediction shows that BTC keeps pushing towards the north as the coin has not lost sight of $45,000.
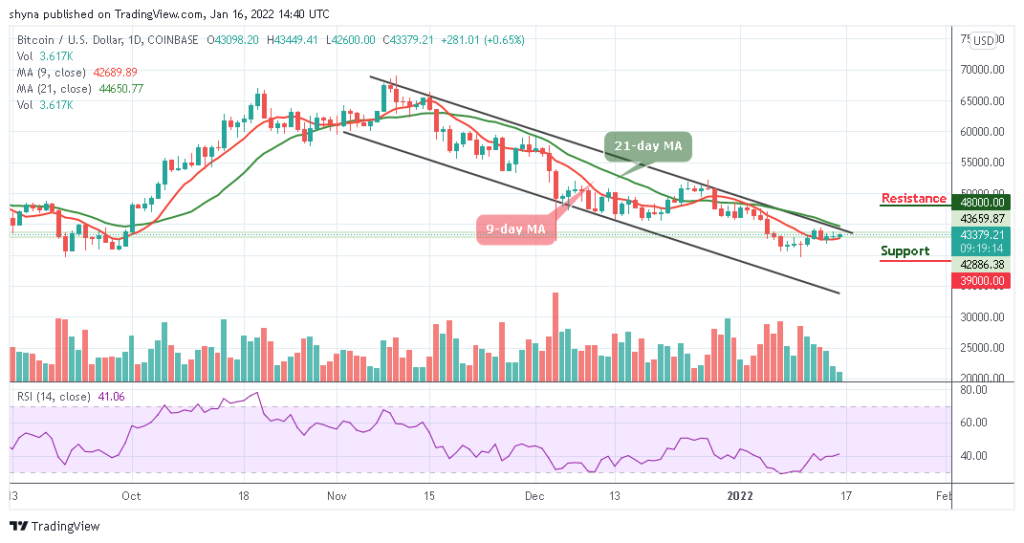
BTC/USD Long-term Trend: Bearish (Daily Chart)
Key levels:
Resistance Levels: $48,000, $50,000, $52,000

Support Levels: $39,000, $37,000, $35,000
Over the past hour, BTC/USD decides to stay above the 9-day moving average to rip higher, adding a slight 0.65% gains to the trading. The king coin is successfully trading towards the 21-day moving average and may likely cross above the upper boundary of the channel. At the time of writing, the first digital asset aims to reach and cross above the resistance level of $45,000 in the next positive moves as the strongly bullish momentum may contribute to nurture an upward movement targeting $45,000 level.
Bitcoin Price Prediction: Bitcoin (BTC) May Revisit the Higher Levels
According to the daily chart, the Bitcoin price, and the daily candle touches the daily high at $43,449 after the market opens today. If the bulls could successfully push the price above the upper boundary of the channel, the next resistance levels may be located at $48,000, $50,000, and $52,000. Typically, when the new uptrends are beginning to form, traders may use the 9-day moving average as the nearest support level.
However, any failure by the bulls to move the price up may see a price drop to $41,000 vital support. A further low drive could send the price to $39,000, $37,000, and $35,000 supports. For now, the market is moving sideways but as things stand, BTC/USD may remain within the ranges of $40,000 and $44,000 because the technical indicator Relative Strength Index (14) may move in the same direction above 40-level.

BTC/USD Medium-Term Trend: Ranging (4H Chart)
The Bitcoin price surges upward today to touch the high of $43,449 before retreating slightly to where it is currently trading at $43,268. However, the closest resistance levels lie at $44,500 and $45,000, while the nearest supports could be located at $42,000 and $41,500 respectively.
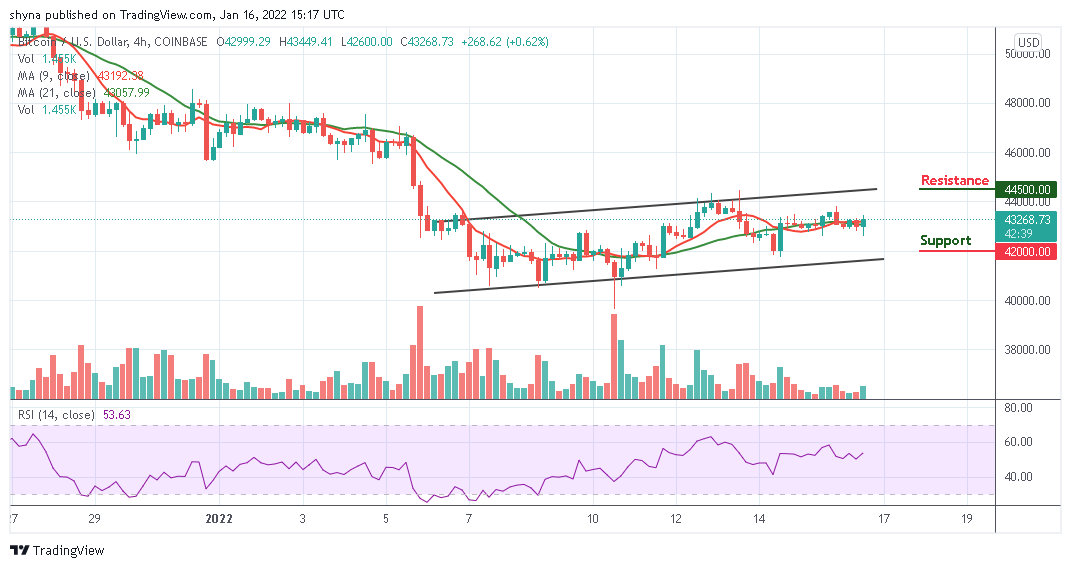
Moreover, as the coin moves above the 9-day and 21-day moving averages, the technical indicator is flashing a buy signal as the Relative Strength Index moves to cross above 60-level, suggesting additional bullish movement into the market.
Looking to buy or trade Bitcoin (BTC) now? Invest at eToro!
68% of retail investor accounts lose money when trading CFDs with this provider
Read more: