BTC/USD Prepares to Climb $45,000

Bitcoin Price Prediction – February 15
The Bitcoin price prediction shows that BTC is hovering at $44,065 after touching the daily high of $44,542 at the beginning of today.
BTC/USD Long-term Trend: Bearish (Daily Chart)
Key levels:
Resistance Levels: $50,000, $52,000, $54,000

Support Levels: $37,000, $35,000, $33,000
At the time of writing, BTC/USD is facing the higher levels as the latest move marks an upwards break of the bullish phase, therefore, it is important to note that the bulls are yet to push the Bitcoin price above the key technical levels. Therefore, the Bitcoin price has been attempting to cross into the positive side since the European session.
Bitcoin Price Prediction: Bitcoin (BTC) Ready for The Upside
The Bitcoin price is trading up above its opening price of $42,548 as the current movement marks a slight climb from where it has been trading for the past few days. However, it is important to note that this current level could mark a bullish break above the upper boundary of the channel. More so, as the technical indicator Relative Strength Index (14) moves to cross above 60-level, the king coin is preparing to face the upside.
However, a continuous bullish movement above the channel could locate the potential resistance at $48,000, reaching this level may allow for an extended recovery towards the resistance levels of $50,000, $52,000, and $54,000. Moreover, if the technical indicator Relative Strength Index (14) retreats below 60-level, BTC/USD may experience another downward movement which may bring the price to the support levels at $37,000, $35,000, and $34,000.

BTC/USD Medium-Term Trend: Ranging (4H Chart)
Looking at the 4-hour chart, BTC/USD needs to stay above the 9-day and 21-day moving averages in other to mitigate the short-term bullish pressure and allow for an extended recovery towards $45,000. Therefore, a higher resistance level may be located at $46,000 and above.
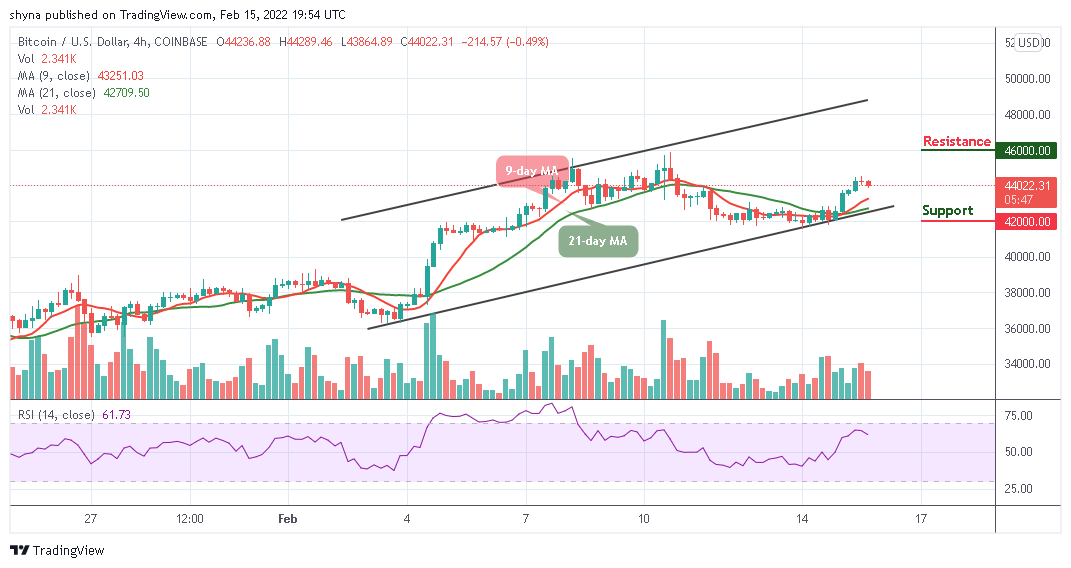
However, the Bitcoin price is likely to fall below the 9-day MA as a sustainable move below this barrier may increase the downside pressure to the support level of $42,000 and below. Meanwhile, the technical indicator Relative Strength Index (14) moves to cross 60-level which may increase the bearish movement.
Looking to buy or trade Bitcoin (BTC) now? Invest at eToro!
68% of retail investor accounts lose money when trading CFDs with this provider
Read more: