BTC/USD Slumps Below $40,000, Price Ready to Drop More
Bitcoin Price Prediction – January 20
The Bitcoin price prediction is down from $43,000 to $37,704 in the last few days as no quick recovery seems possible for the coin now.
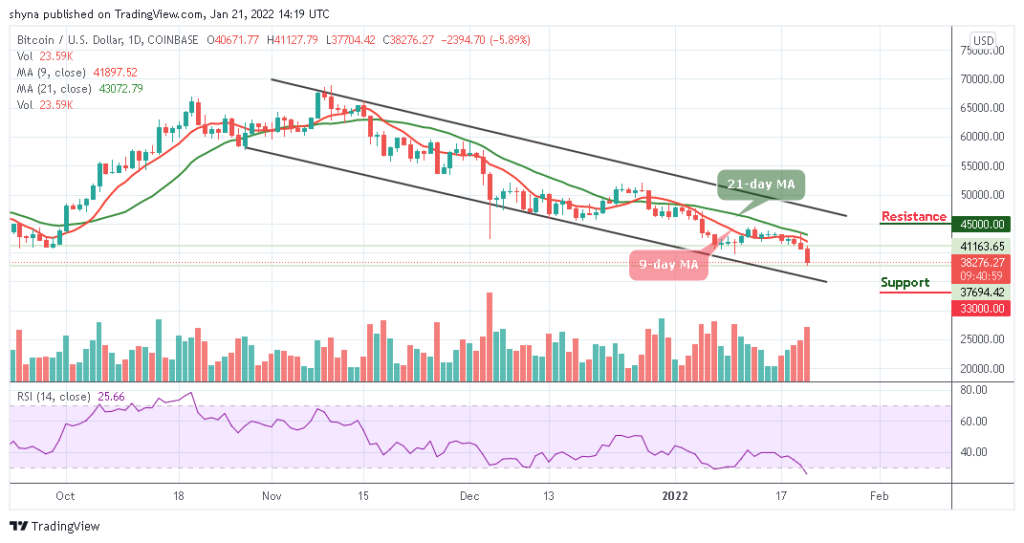
BTC/USD Long-term Trend: Bearish (Daily Chart)
Key levels:
Resistance Levels: $45,000, $47,000 $49,000

Support Levels: $33,000, $31,000, $29,000
BTC/USD continue to face a setback as this could be a serious issue and it is likely for the coin to have a bullish run in the short-term, but a price rally may help the first digital asset to touch its daily high. Currently, BTC/USD is trading around $38,276 level after a free fall from $41,127 a few hours back and the coin has shown tremendous volatility over the past few days.
Bitcoin Price Prediction: Bitcoin (BTC) May Stay Within the Negative Side
Looking at the daily chart, for the Bitcoin price to touch the low of $37,704 today, if the price should slump below the lower boundary of the channel, the $34,000 mark could be an important zone to keep an eye on. Therefore, crossing below this level may allow the king coin to hit the supports at $33,000, $31,000, and $29,000.
On the other hand, the technical indicator Relative Strength Index (14) is crossing into the oversold region as trading volume is fading out. If the king coin decides to move the price above the 9-day and 21-day moving averages, BTC/USD may see resistance levels at $55,000, $57,000, and $59,000.

BTC/USD Medium-Term Trend: Bearish (4H Chart)
On the 4-Hour chart, the Bitcoin price hovers below the 9-day and 21-day moving averages to touch the low of $37,581. However, should the bulls gather enough strength and cross above the 9-day moving average; the coin may likely locate the resistance level of $40,000 and above.
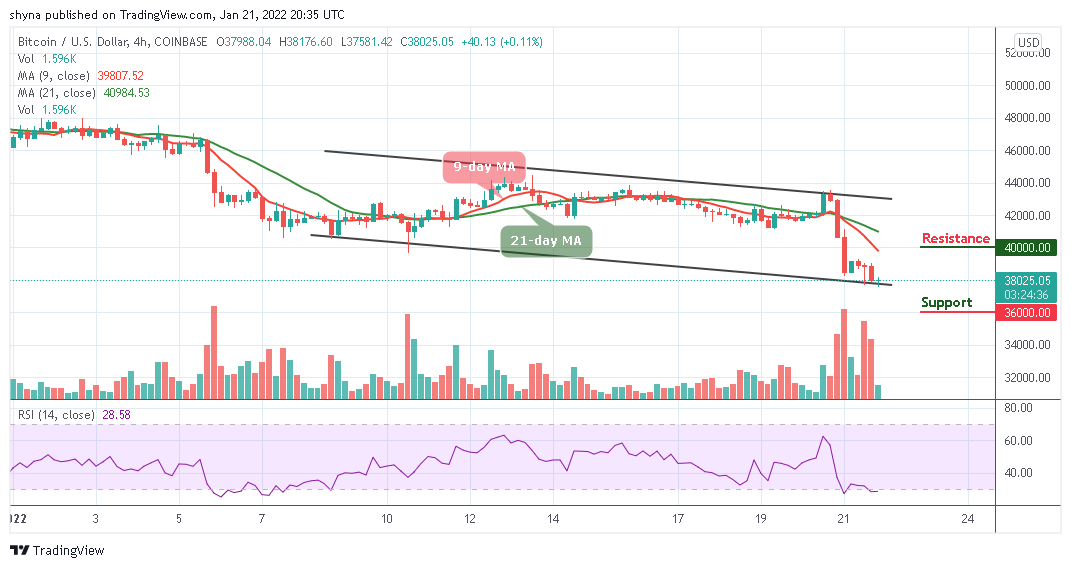
However, on the downside, immediate support could be found at $37,000 level while crossing below the lower boundary of the channel may locate the critical support level of $36,000 and below. Looking at the chart, the technical indicator Relative Strength Index (14) is already moving within the oversold region.
Looking to buy or trade Bitcoin (BTC) now? Invest at eToro!
68% of retail investor accounts lose money when trading CFDs with this provider
Read more: