
BTC/USD Turns Bearish Below $42,000 Support
Bitcoin Price Prediction – February 11
The Bitcoin price prediction extends the bearish movement to the areas marginally below $42,000 after numerous trials to sustain gains above $43,000.
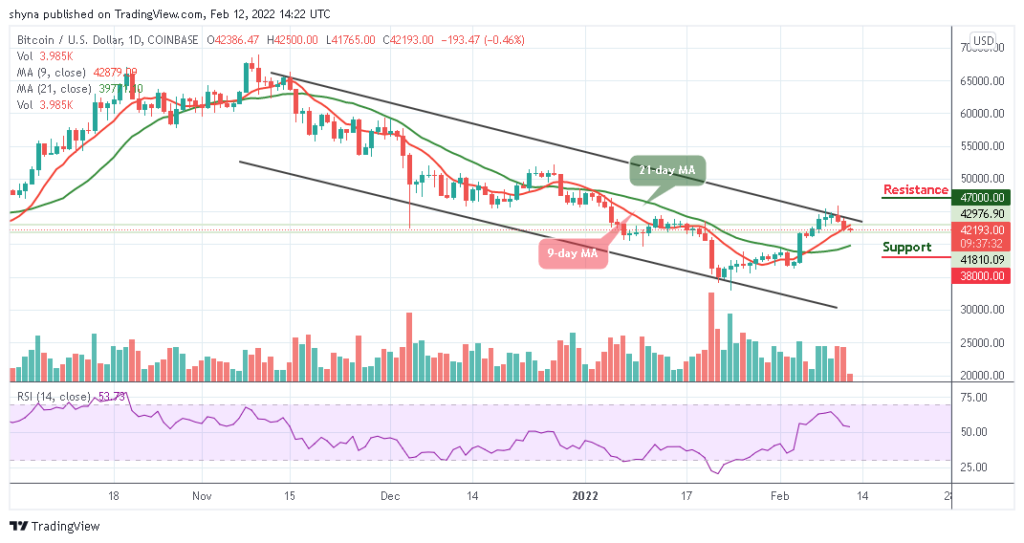
BTC/USD Long-term Trend: Bearish (Daily Chart)
Key levels:
Resistance Levels: $47,000, $49,000, $51,000

Support Levels: $38,000, $36,000, $34,000
BTC/USD falls toward $41,500 today as the largest cryptocurrency embarked on a support smashing exercise after failing to hold above $43,000 following a significant breakout in the last few days. Therefore, the bearish control is seen across the market with other major digital assets posting similar losses as they trade towards the 9-day and 21-day moving average.
Bitcoin Price Prediction: Bitcoin (BTC) May Increase the Bearish Movement
The Bitcoin price is hovering at $42.193 with an intraday loss of 0.46%. According to the daily chart, the current trend is bearish with expanding volatility, and the king coin is likely to consolidate in a bearish flag pattern. Meanwhile, a breakdown below the 21-day moving average may continue in the direction of the previous trend. In this case, BTC/USD is expected to drop and stay below to hit the critical support levels at $38,000, $36,000, and $34,000.
However, should Bitcoin price returns above the upper boundary of the channel; the price could rise to $45,000 vital resistance. A further bullish drive could push the price to $47,000, $49,000, and $51,000 resistance levels. The technical indicator Relative Strength Index (14) is revealing a continuous bearish, which shows that the market may follow the downside.

BTC/USD Medium – Term Trend: Ranging (4H Chart)
At the opening of the market today, the Bitcoin price remains below the 9-day and 21-day moving averages to continue the downward movement, bringing its price to trade around $42,002. Meanwhile, should the price continue to drop further and move below the lower boundary of the channel, it could reach the support level at $40,000 and below.
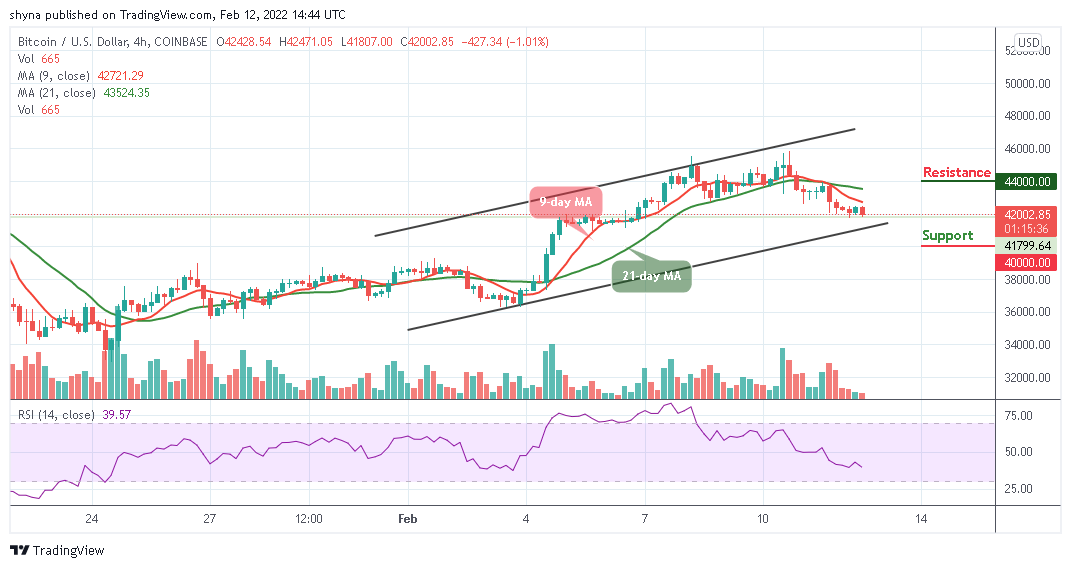
Moreover, if the bulls push the coin above the 9-day and 21-day moving averages, the Bitcoin price could hit the resistance level of $44,000 and above. Now, the market may begin to move sideways or experience more downtrends as the Relative Strength Index (14) indicator moves below 40-level.
Looking to buy or trade Bitcoin (BTC) now? Invest at eToro!
68% of retail investor accounts lose money when trading CFDs with this provider
Read more: