Bitcoin (BTC/USD) Market Operation Ranges at $65,000

Bitcoin Price Prediction – November 14It currently recorded that the BTC/USD market operation ranges around $65,000 line after it failed to uphold its valuation elongation above the new all-time point. The crypto-economic price now trades around $64,584 at a smaller negative percentage rate of about 0.24.
BTC/USD Market Key Levels:Resistance levels: $67,500, $70,000, $72,500Support levels:: $60,000, $57,500, $55,000BTC/USD – Daily ChartThe BTC/USD daily chart showcases that the flagship crypto-economic market operation ranges around a $65,000 trading level. The range-bound trend lines drew, marking the value line earlier mentioned and the $60,000 level. The 14-day SMA trend line has protruded into the range-bound trading zones as the 50-day SMA trend line is underneath it. The Stochastic Oscillators have briefly dipped past the range of 20 into the oversold region. That shows that some downward moves are somewhat ongoing.
Is there any probability that price will return to the lower range line at $60,000 as the BTC/USD market operation ranges at $65,000?
There is a probability that price return, moving downward for a retest of the lower range line at $60,000 as the BTC/USD market operation ranges at $65,000 level currently. That said, such presumed downward-moving motion will, in the long run, allow a solid support baseline building around the lower range zone at a later session. Based on that sentiment, long position takers needed to be alert while that assumption plays out.
On the downside, the BTC/USD market sellers should exercise some degrees of patience in exerting shorting positions at this point. Several smaller pull-ups turning into reversal motion against the upper range value line at $65,000 could signal that sellers may get prepared to take advantage of by taking a re-launch of their positions in the market.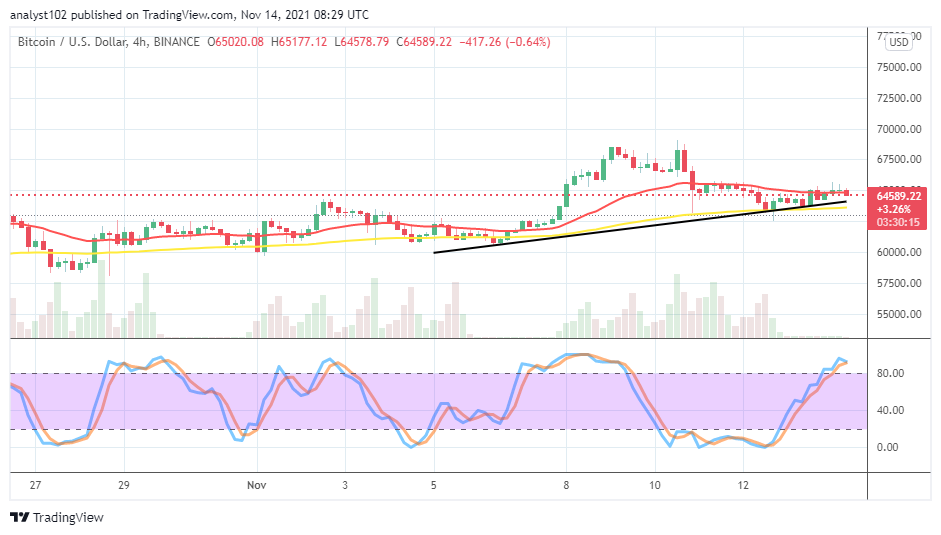

BTC/USD 4-hour Chart
The BTC/USD 4-hour chart reveals that the crypto-economic market operation ranges between $65,000 and $62,500. The 14-day SMA trend line is above the 50-day SMA trend line. The bullish trend line drew to intercept the bigger SMA indicator. The Stochastic Oscillators have inadvertently moved northbound into the overbought region. And, they now attempt to close the lines a bit above range 80. That could eventually lead the market into getting set to lose some momentums for a while in the subsequent sessions.
Looking to buy or trade Bitcoin (BTC) now? Invest at eToro!

68% of retail investor accounts lose money when trading CFDs with this provider.
Read more: