BTC/USD Turns Bearish as Price Drops to $62,300
Bitcoin Price Prediction – November 12
The Bitcoin price keeps extending the bearish movement to the areas below the support level of $63,000 in order to sustain gains above $65,000.
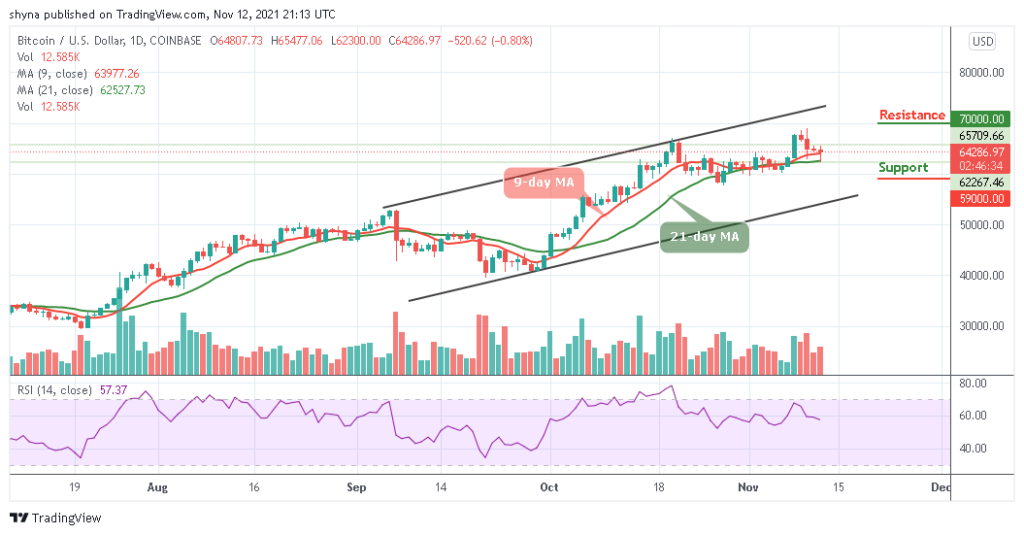
BTC/USD Long-term Trend: Ranging (Daily Chart)
Key levels:
Resistance Levels: $70,000, $72,000, $74,000

Support Levels: $59,000, $57,000, $55,000
BTC/USD falls toward $65,000 once again as the largest cryptocurrency embarked on a support smashing exercise after failing to hold above $62,300 following a significant breakout in the last few days. Therefore, the bearish control is seen across the market with other major digital assets posting similar losses as they may cross below the 9-day and 21-day moving averages.
Bitcoin Price Prediction: Bitcoin (BTC) Could Slip Below $62k
The Bitcoin price is hovering at $64,286 with an intraday loss of 0.80%. Looking at the daily chart, the prevailing trend is bearish with expanding volatility as the first digital asset is likely to consolidate in a bearish flag pattern. Meanwhile, a breakdown below the moving averages is supposed to continue in the direction of the previous trend. In this case, BTC/USD is expected to drop and stay below to hit the critical support levels at $59,000, $57,000, and $55,000.
However, should Bitcoin price returns above the moving averages; the price could rise to $65,000 vital resistance. A further bullish drive could push the price to $70,000, $72,000, and $74,000 resistance levels. The technical indicator Relative Strength Index (14) is revealing a continuous bearish, which shows that the market may remain at the downside.

BTC/USD Medium – Term Trend: Ranging (4H Chart)
At the opening of the market today, the Bitcoin price faces up to touch the resistance level of $64,234 but may likely drop below the channel, bringing its price to trade around $62,000. Meanwhile, should the price continue to drop further and move below the lower boundary of the channel, it could reach the support level at $61,000 and below.
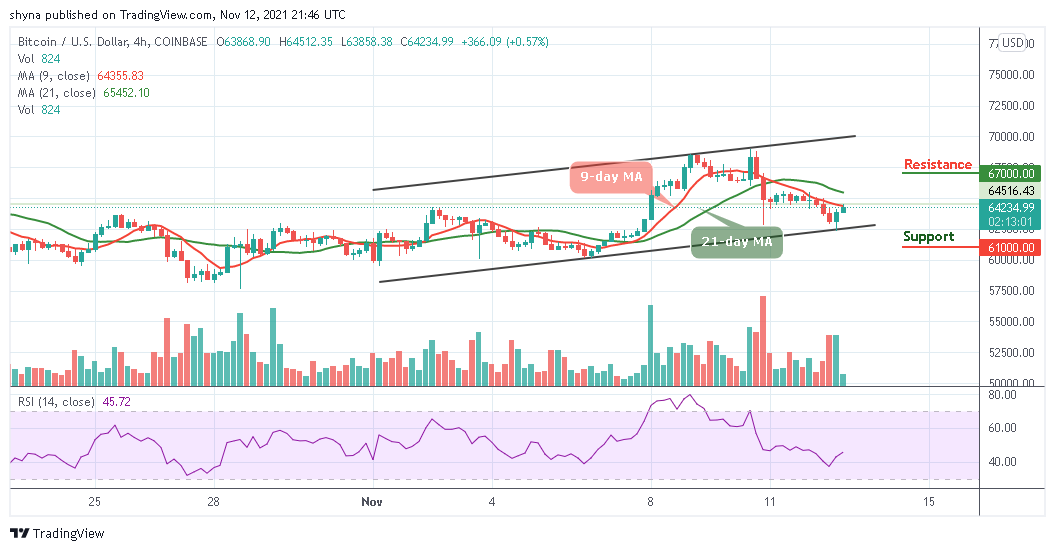
Moreover, if the bulls push the coin above the 9-day and 21-day moving averages, the Bitcoin price could revisit the resistance level of $67,500 and above. Presently, the market may begin to move sideways or experience slight uptrends as the Relative Strength Index (14) indicator moves below 40-level.
Looking to buy or trade Bitcoin (BTC) now? Invest at eToro!
68% of retail investor accounts lose money when trading CFDs with this provider
Read more: